Gantt Chart
Overview
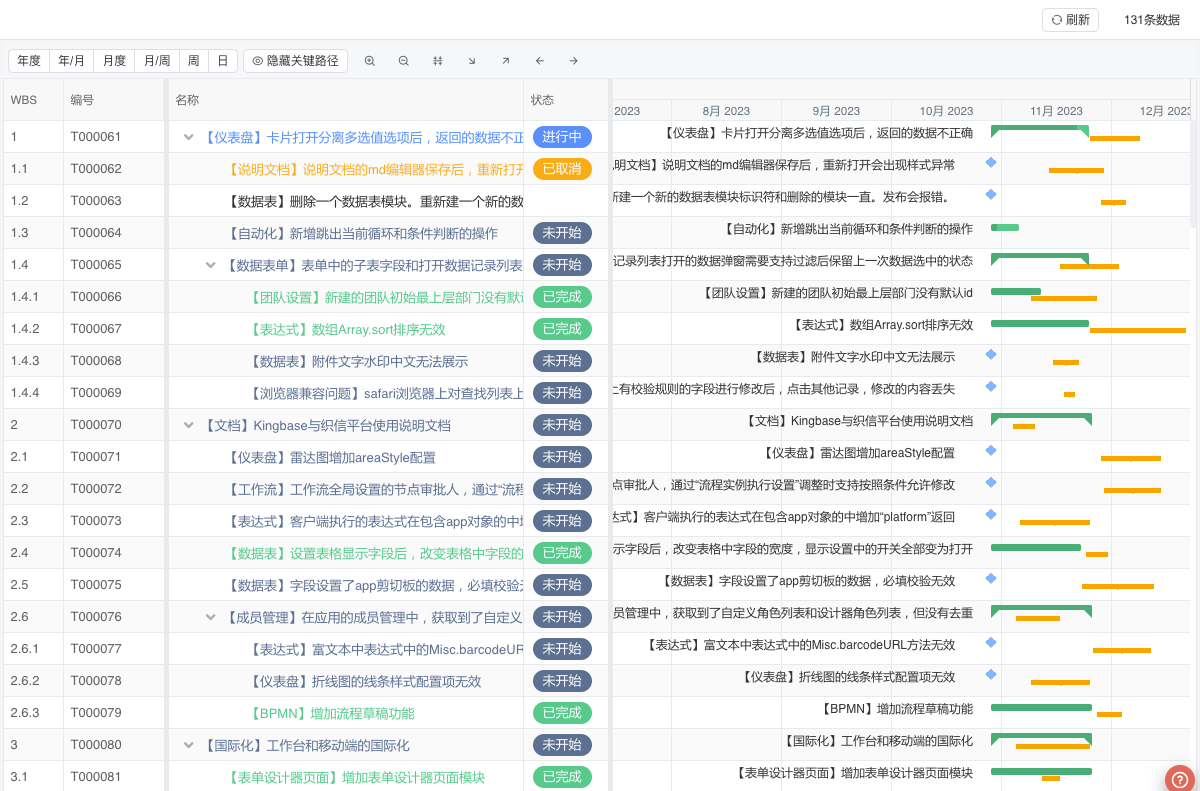
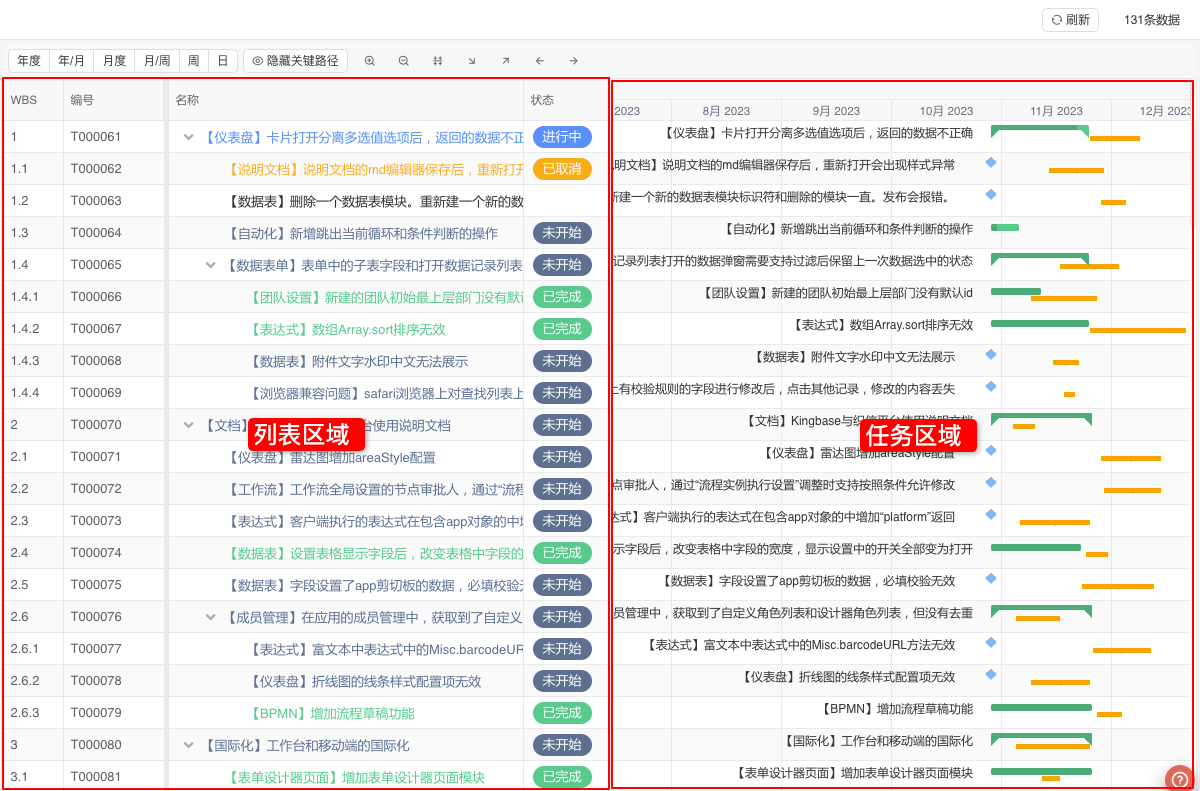
The Gantt Chart view is a commonly used view in project/task management, which graphically represents the sequence and duration of specific projects through activity lists and time scales. It mainly consists of a fixed table area on the left and a task area on the right.
Application Scenarios
Gantt charts can help managers understand the remaining tasks of a project and assess work progress. In addition, Gantt charts can also be applied to data display in various reservation scenarios, such as meeting room reservation status, course reservation status, etc.
Terminology
There are two important concepts in Gantt charts: Baseline and Critical Path.
Baseline
The baseline is the initial version of the project plan, and it is the benchmark for project schedule planning, cost budgeting, and resource allocation. It is used to measure the difference between actual project progress and the plan.
Critical Path
The critical path is the longest task sequence in a project, which determines the shortest completion time of the project. Each task on the critical path has no time float, meaning any delay in these tasks will directly lead to a delay in the entire project.
Settings
| Setting | Description |
|---|---|
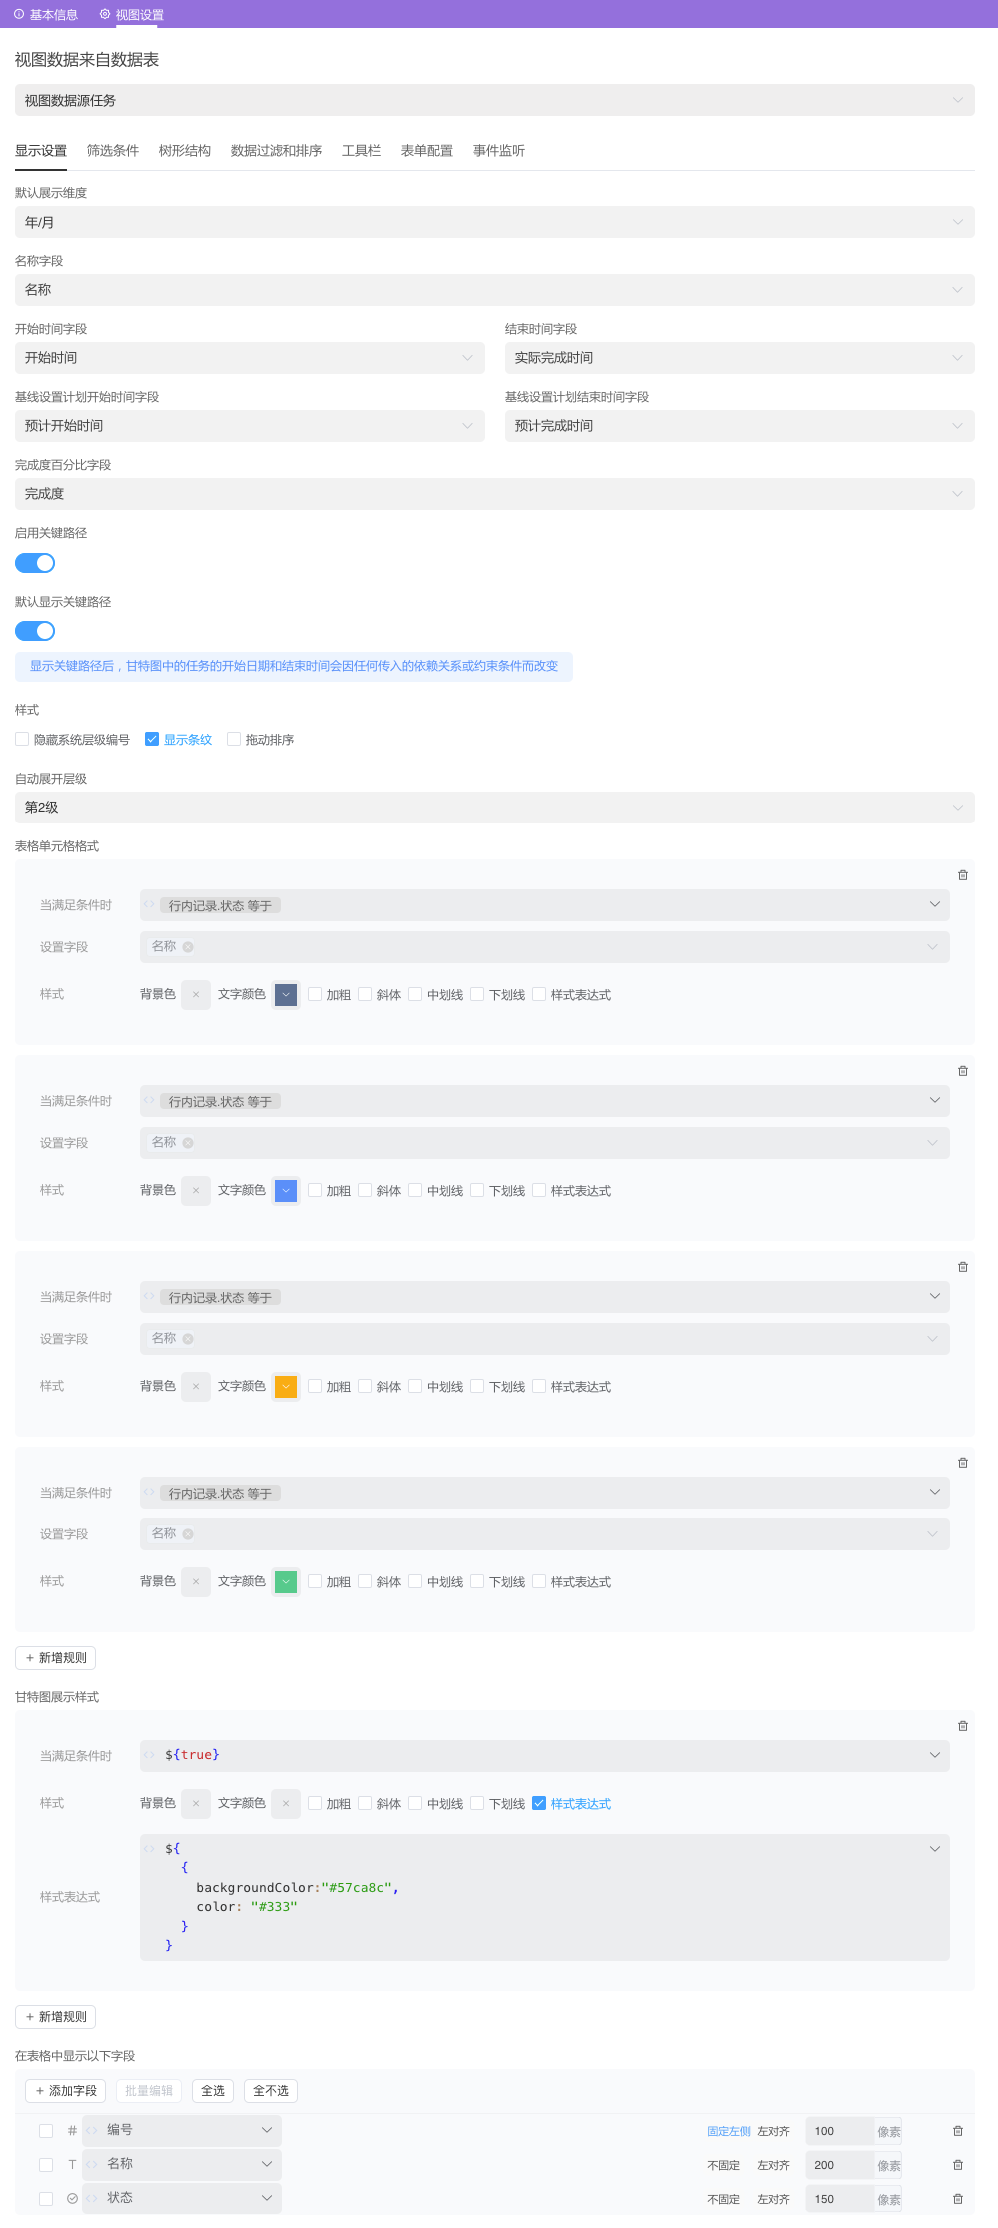
| Default Display Dimension | The default time dimension displayed by the Gantt chart. Options: Yearly, Year/Month, Monthly, Month/Week, Weekly, Daily |
| Name Field | Sets the task name of the Gantt chart. |
| Start Time Field | Sets the start time of the task in the Gantt chart. The data table must contain a Date type field. |
| End Time Field | Sets the end time of the task in the Gantt chart. The data table must contain a Date type field. |
| Completion Percentage Field | Sets the completion percentage of the task in the Gantt chart. The data table must contain a Decimal or Integer type field. |
| Predecessor Task Field | Sets the predecessor task of the task in the Gantt chart. The data table must contain a Related List type field. |
| Style | Sets the display/hide of System Level Number, Stripes, and Drag Sort Button. |
| Auto Expand Level | If a Child Object field is set, you can set the default expanded data level in the list data. The default expanded level in the tree structure of the Gantt chart will be based on this field. |
| Baseline Planned Start Time Field | Sets the baseline planned start time of the task in the Gantt chart. The data table must contain a Date type field. |
| Baseline Planned End Time Field | Sets the baseline planned end time of the task in the Gantt chart. The data table must contain a Date type field. |
| Table Cell Format | Affects the Table Area. Sets the display format of table cells that meet the conditions through expressions. Multiple rules are supported. |
| Gantt Chart Display Style | Affects the Task Area. Sets the display format of Gantt chart tasks that meet the conditions through expressions. Multiple rules are supported. |
| Display the following fields in the table | You can set the fields displayed in the table on the form page. |
Style
In the table cell format, the background color does not take effect on the cell where the name field is located.
In the Gantt chart display style, the background color only supports HEX format and color names, such as red, blue, etc.
Example
We will use task management as an example to set up a Gantt chart view.