3.7 Data and Views: Table Settings
Let's go back to the restaurant analogy.
- Data: The [Department Table] we created and all the department information we just entered are like being stored in a huge, ordered warehouse. This is where all the most original and complete "ingredients" are stored. Data itself only cares about storage; it doesn't care what "shape" it should appear in.
- Views: A "view" is like a "exquisite exhibition hall" or "themed display cabinet" tailored for these ingredients. As a restaurant manager, you would never open the entire warehouse directly to customers. Instead, you would carefully design exhibition cabinets:
- "Today's Recommendation" cabinet: Only displays some ingredients.
- "Alcohol" cabinet: Only displays alcoholic ingredients, sorted by price.
- "Seafood" cabinet: Only displays seafood, grouped by origin.
A view is precisely such a preset "cabinet design plan". It extracts data from the "data warehouse" and presents it according to the rules you preset. You can create countless different views for the same data table to meet the viewing needs of different scenarios and roles.
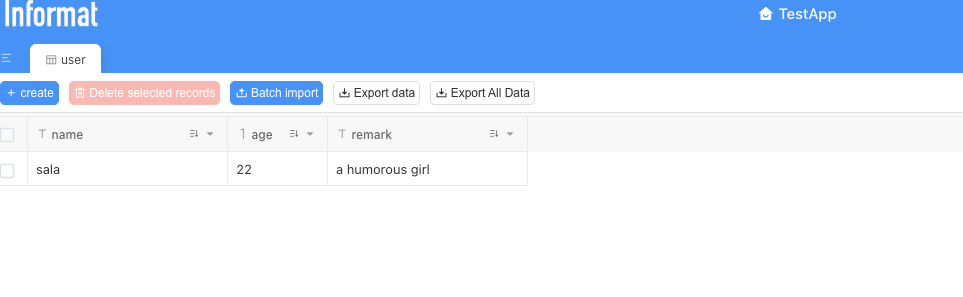
The situation we're facing now is: We have successfully put "ingredients" (department data) into the "warehouse" (department table), but we haven't designed any "exhibition hall" (view) for it. Therefore, the system can only tell you "these things are in the warehouse" in the most original and simple way (the checklist you saw), but it doesn't "display" them.
Now, let's return to the "kitchen" and design the most classic and commonly used "exhibition hall" for our [Department Table] - a clear table view.
Return to the Application Design Interface Please go back to the "Application Design" interface again and click on the familiar [Department Table] in the left menu.
Display Settings In the design interface of [Department Table], find and click the "Table Settings" tab.
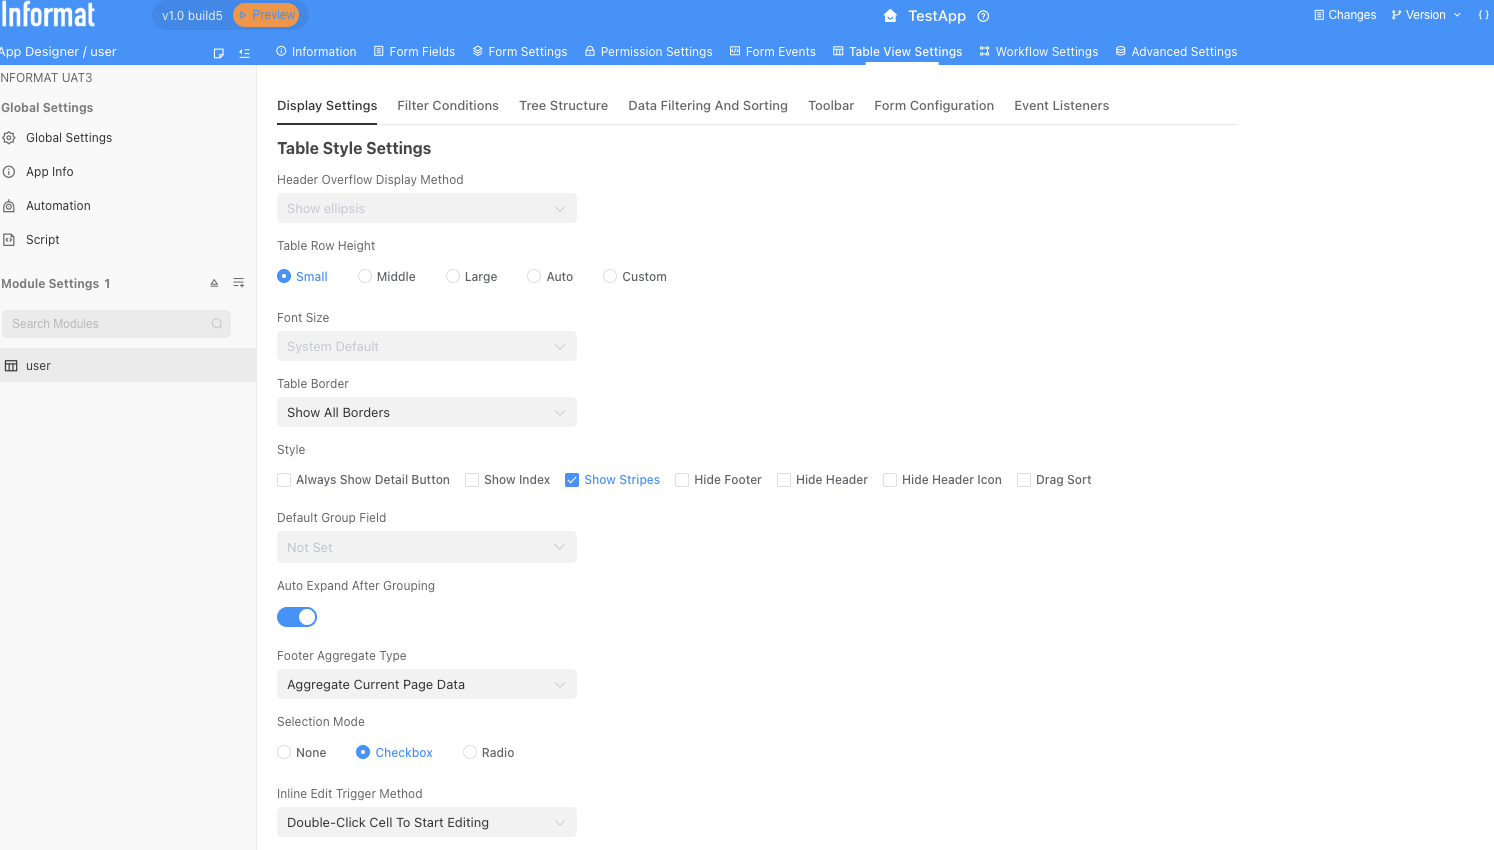
Don't be intimidated by the numerous options; they are all "decoration tools" prepared to make your table more outstanding. We can use the default values for most of the options and not make any changes.
Come to the table field settings area at the bottom of the configuration page, which is the core area for configuring which columns to display. This is where you decide which "fields" this view should "exhibit". Through the
+ Add Fieldbutton, you can select the columns you need to display in this view from all the fields in [Department Table].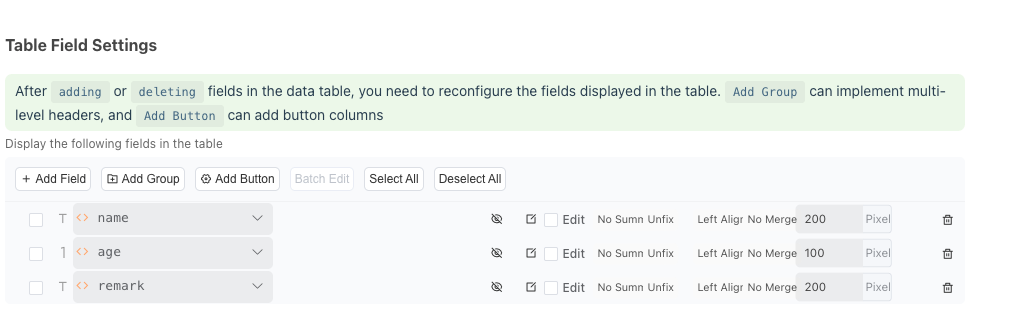
After clicking OK, you can drag to adjust the display order of fields in the following list, and also set the display width of a certain column.
Filter Settings If the amount of data is very large, it will be very difficult for users to find specific information. The setting of "filter conditions" can provide the system with the ability to find data on demand (for example, "only look at departments where Zhang San is the manager" or "only look at departments established in 2024").
In the table settings, find and click the "Filter Conditions" management tab.
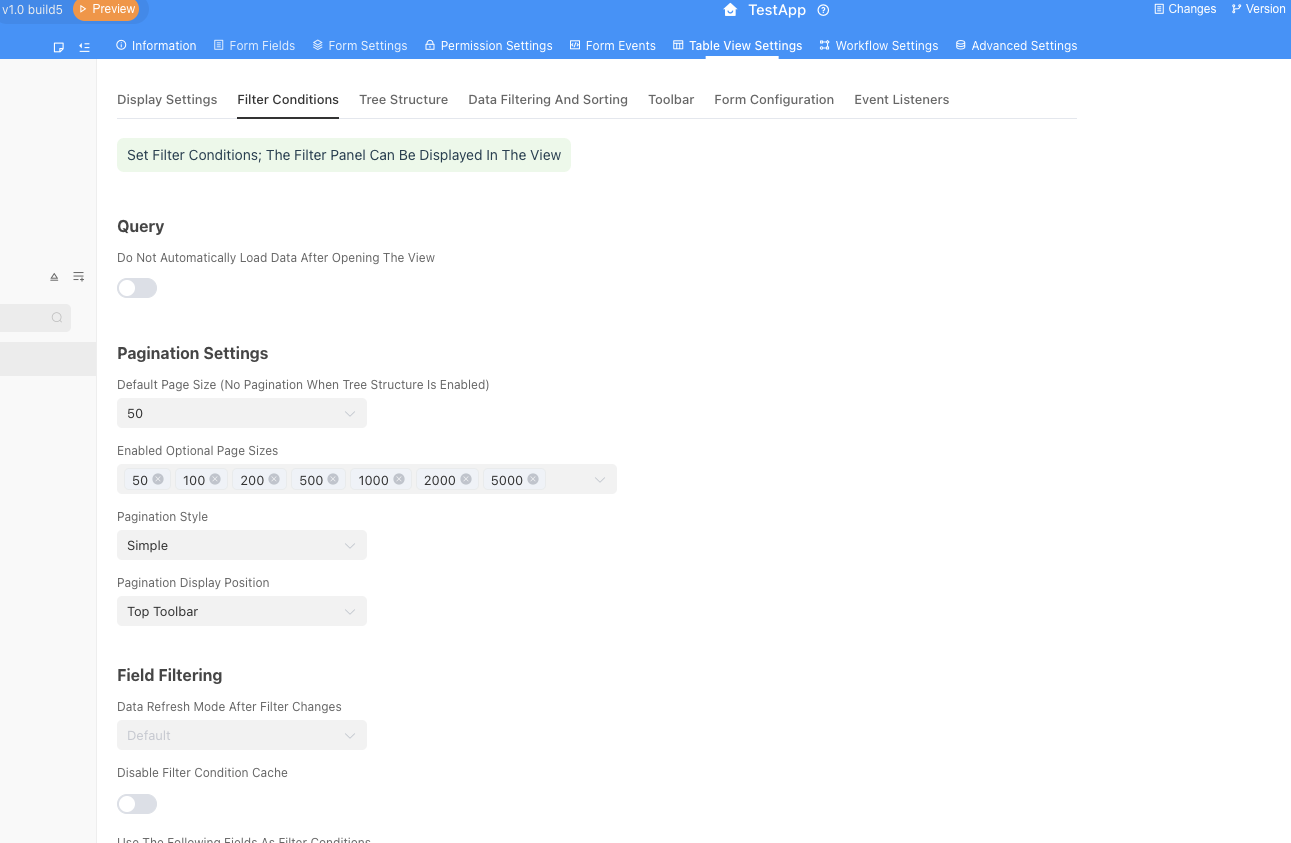
(1) Pagination Settings
When you have hundreds or thousands of data entries, loading them all at once will slow down the system and make it feel like "finding a needle in a haystack" for users to browse. Pagination is the solution.
- Core function: Divide data into pages for display, for example, 50 entries per page.
- Main settings:
Default number of entries per page: How many entries of data are displayed per page by default when a user opens the page. Usually set to 50 or 100.Enabled optional page sizes: Allow users to switch the number of entries displayed per page, providing more flexibility.Pagination display position: Control whether the "Previous Page/Next Page" buttons are displayed at the top or bottom of the table.
(2) Field Filtering
This is the most important part of this section. Here you define which conditions users can use to filter data.
Core concept: Each "field filter" you add here will be converted into an filter control (such as a drop-down selection box or a text input box) that users can operate in the front-end application.
How to add filter conditions:
Click the
+ Add Field Filterbutton, and try to set Name, Manager, and Establishment Year as filter conditions.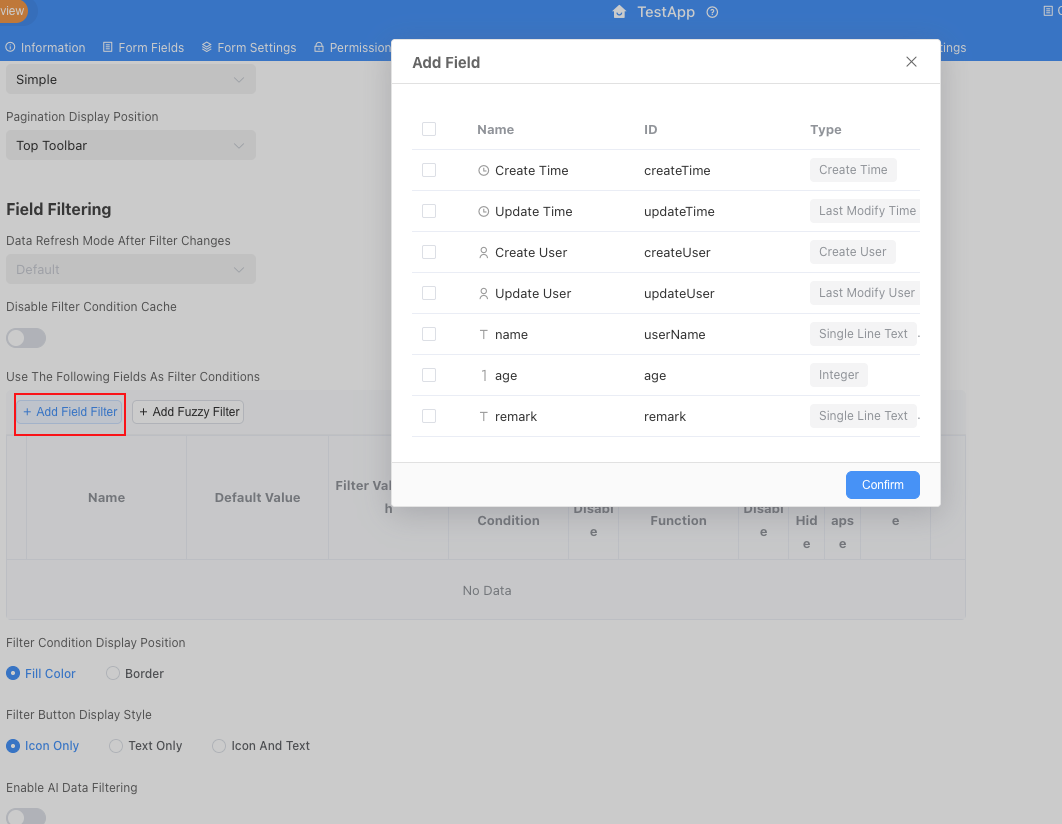
Filter condition display position: This setting determines where the entire "navigation panel" appears on the page.
Left sideis suitable for complex scenarios with many filter conditions, whileTopis more concise and compact. We can modify it to the top here.
After modifying the display settings and filter settings, publish the application and then return to the front-end application to check. Just above the table data, the three filter controls we just configured appear: "Manager", "Establishment Year", and "Name".
Through this small "twist", you have already mastered the core idea of "data-view" separation in Informat applications. This concept will run through all your future application design processes. Always remember: Data is responsible for storage, views are responsible for display.
Now, the "foundation" of our application is extremely solid. Next, we will complete the design and configuration of the employee table at a faster pace.