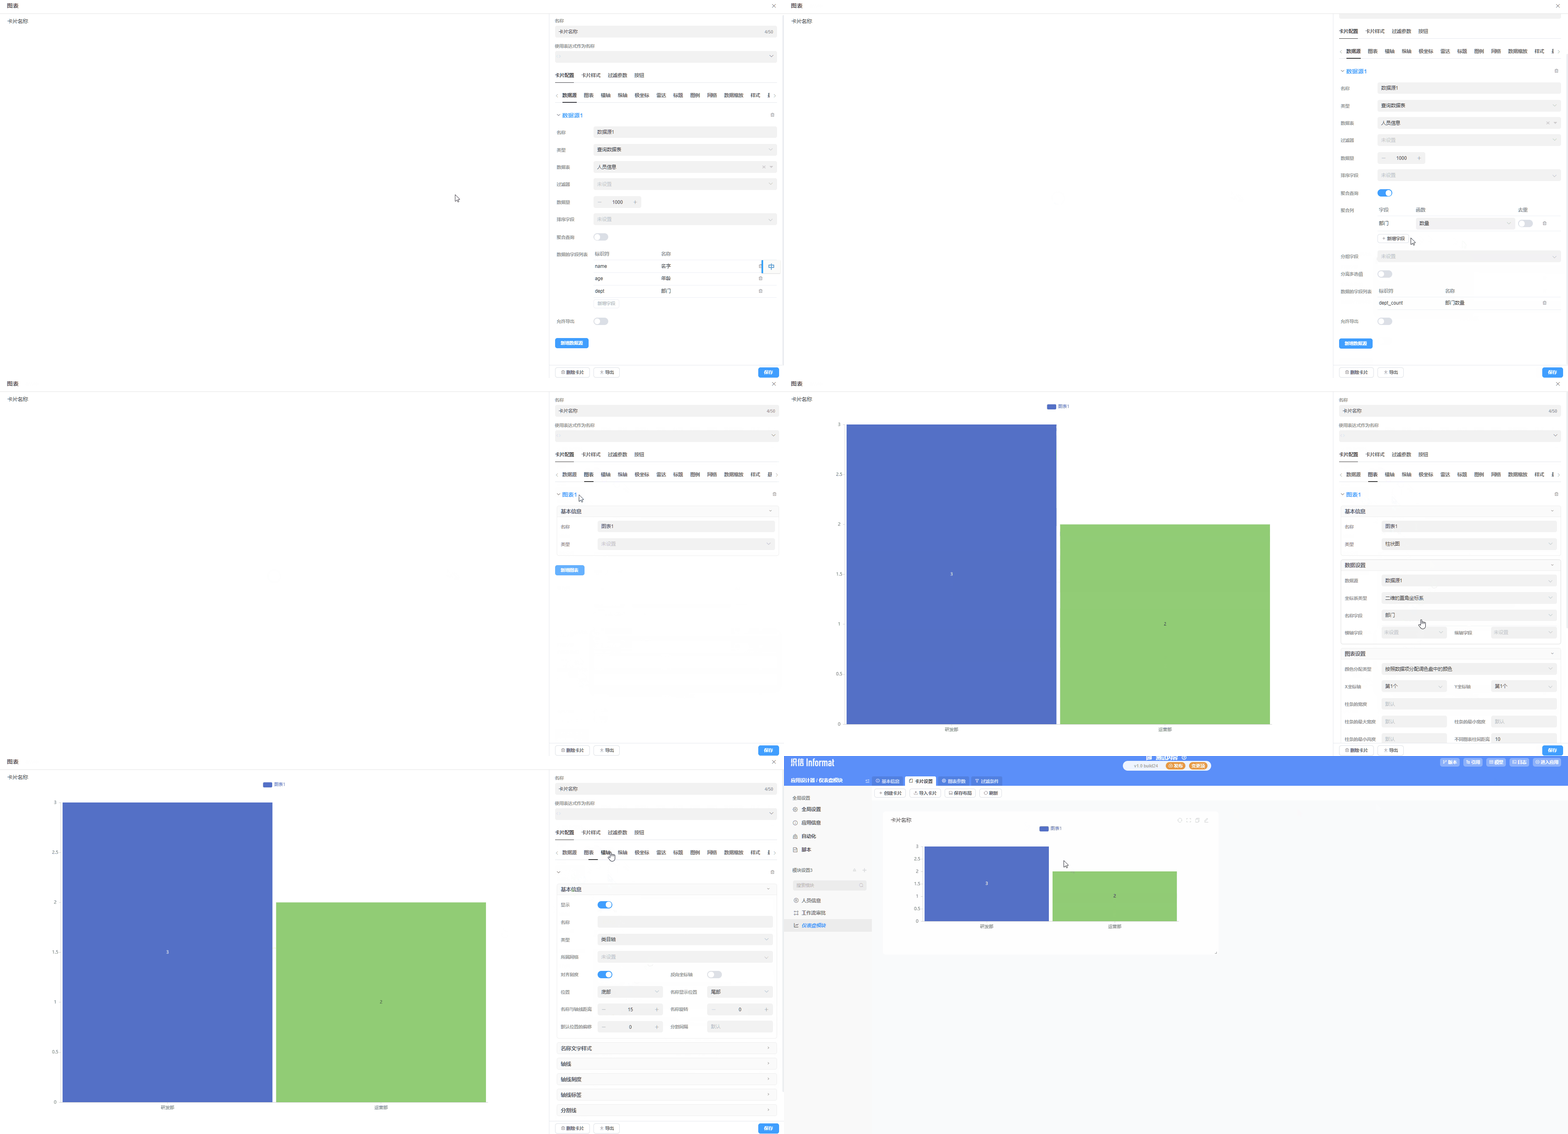
Create Dashboard
1. Introduction
Informat's dashboard module provides users with a highly visual custom chart configuration tool, supporting the configuration of visual data dashboards composed of multiple card types according to business needs. Informat's dashboard supports 25 types of cards including line charts, bar charts, pie charts, maps, Gantt charts, statistical figures, timelines, heat maps, etc. Click here for details.
2. Dashboard Creation Process
2.1 Enter Application Designer
Access the application design module, select the application to be designed, and enter application design. 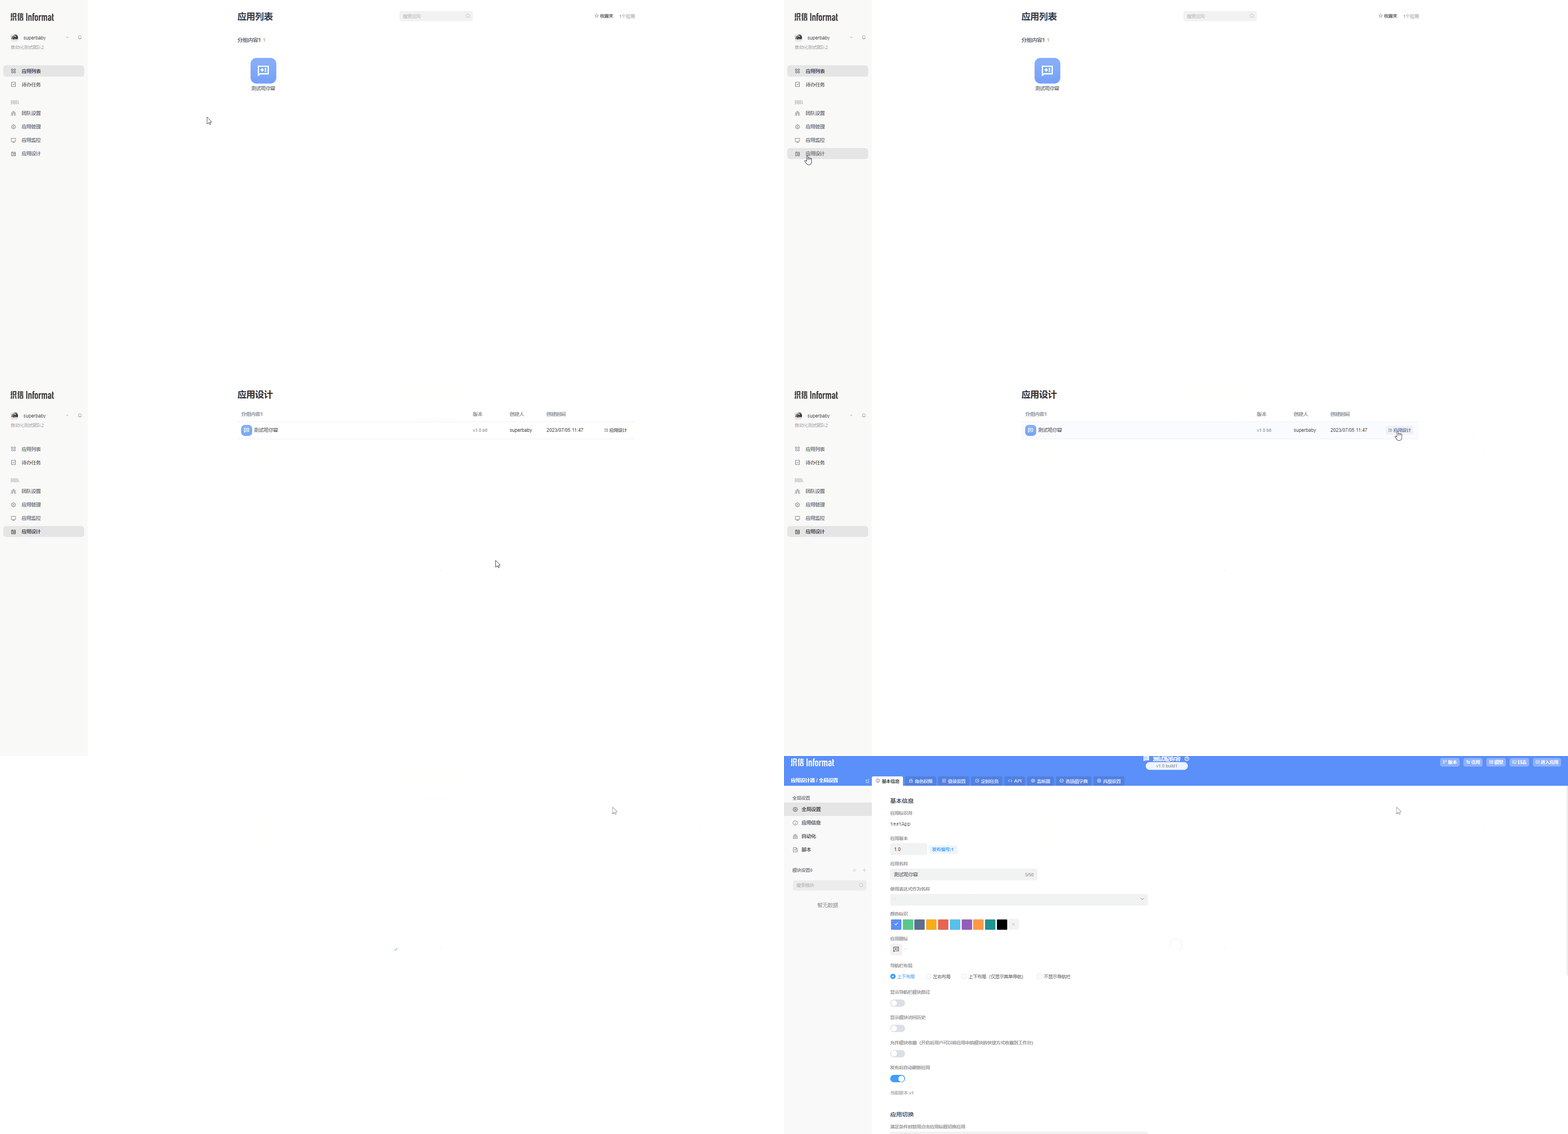
2.2 Create Dashboard Module
In the module settings on the left side of the application designer, click the add icon, and select Dashboard Module in the pop-up window to create it. 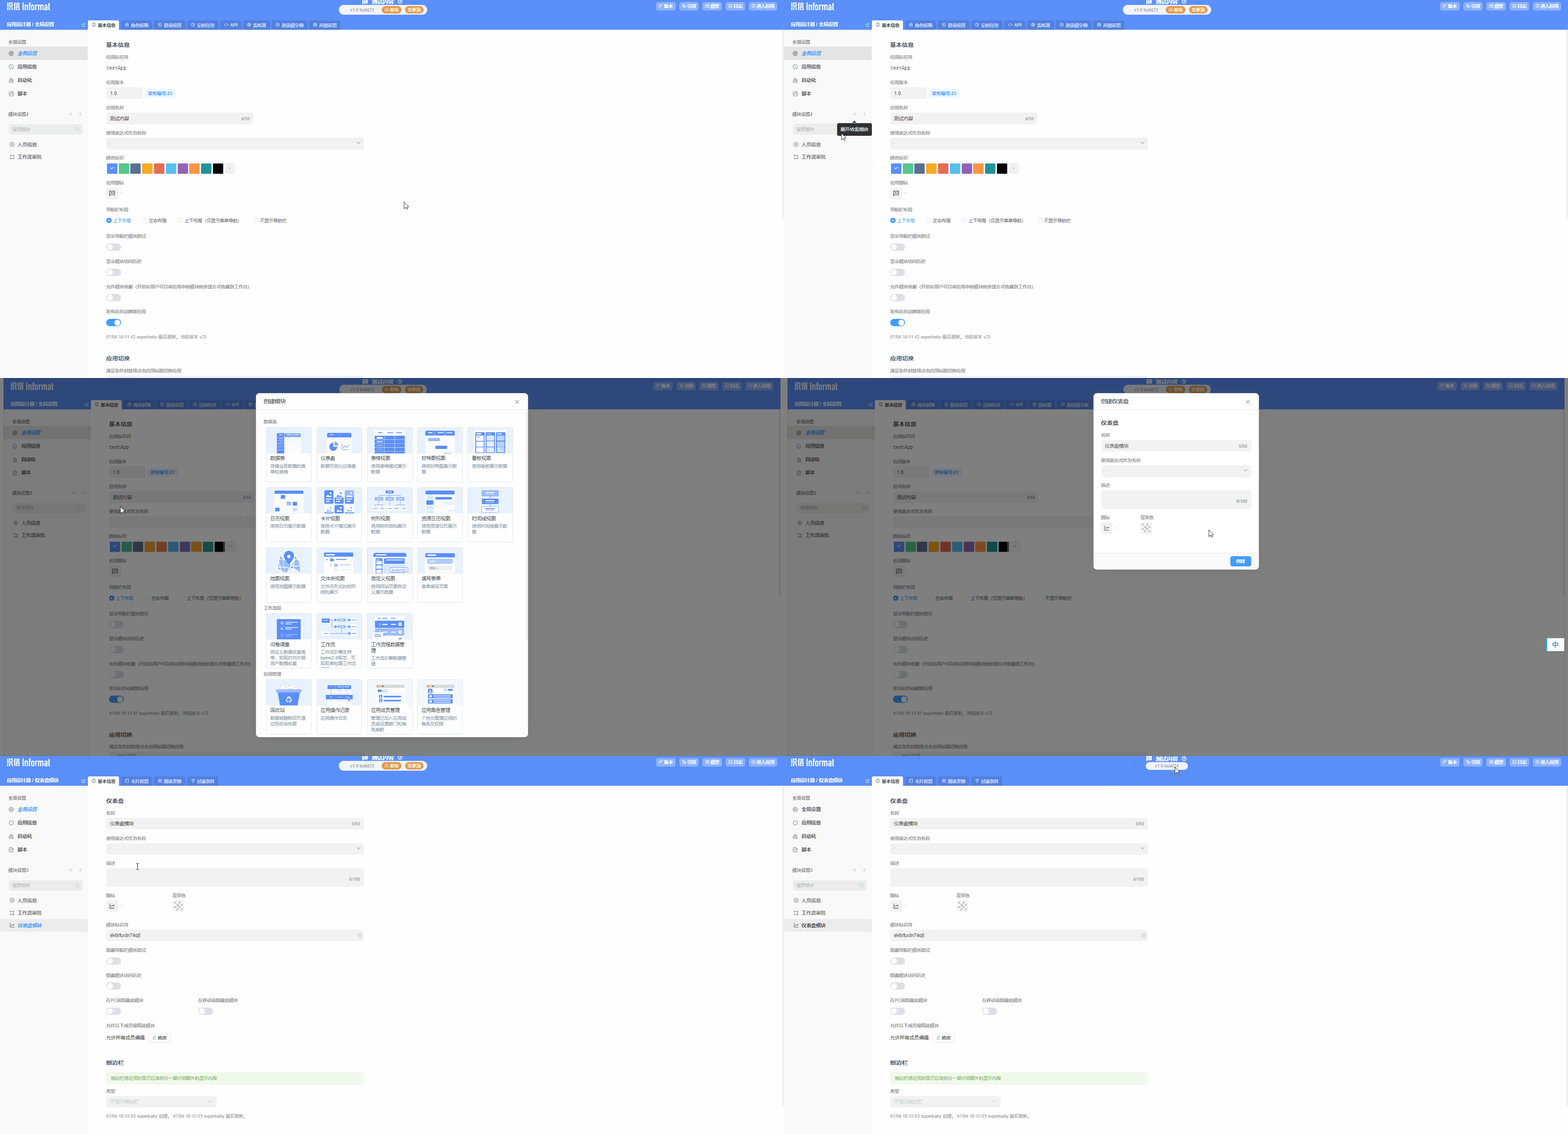
2.3 Create Chart Card
Under the Card Settings tab of the dashboard module, click the Create Card button and select our chart card to create. 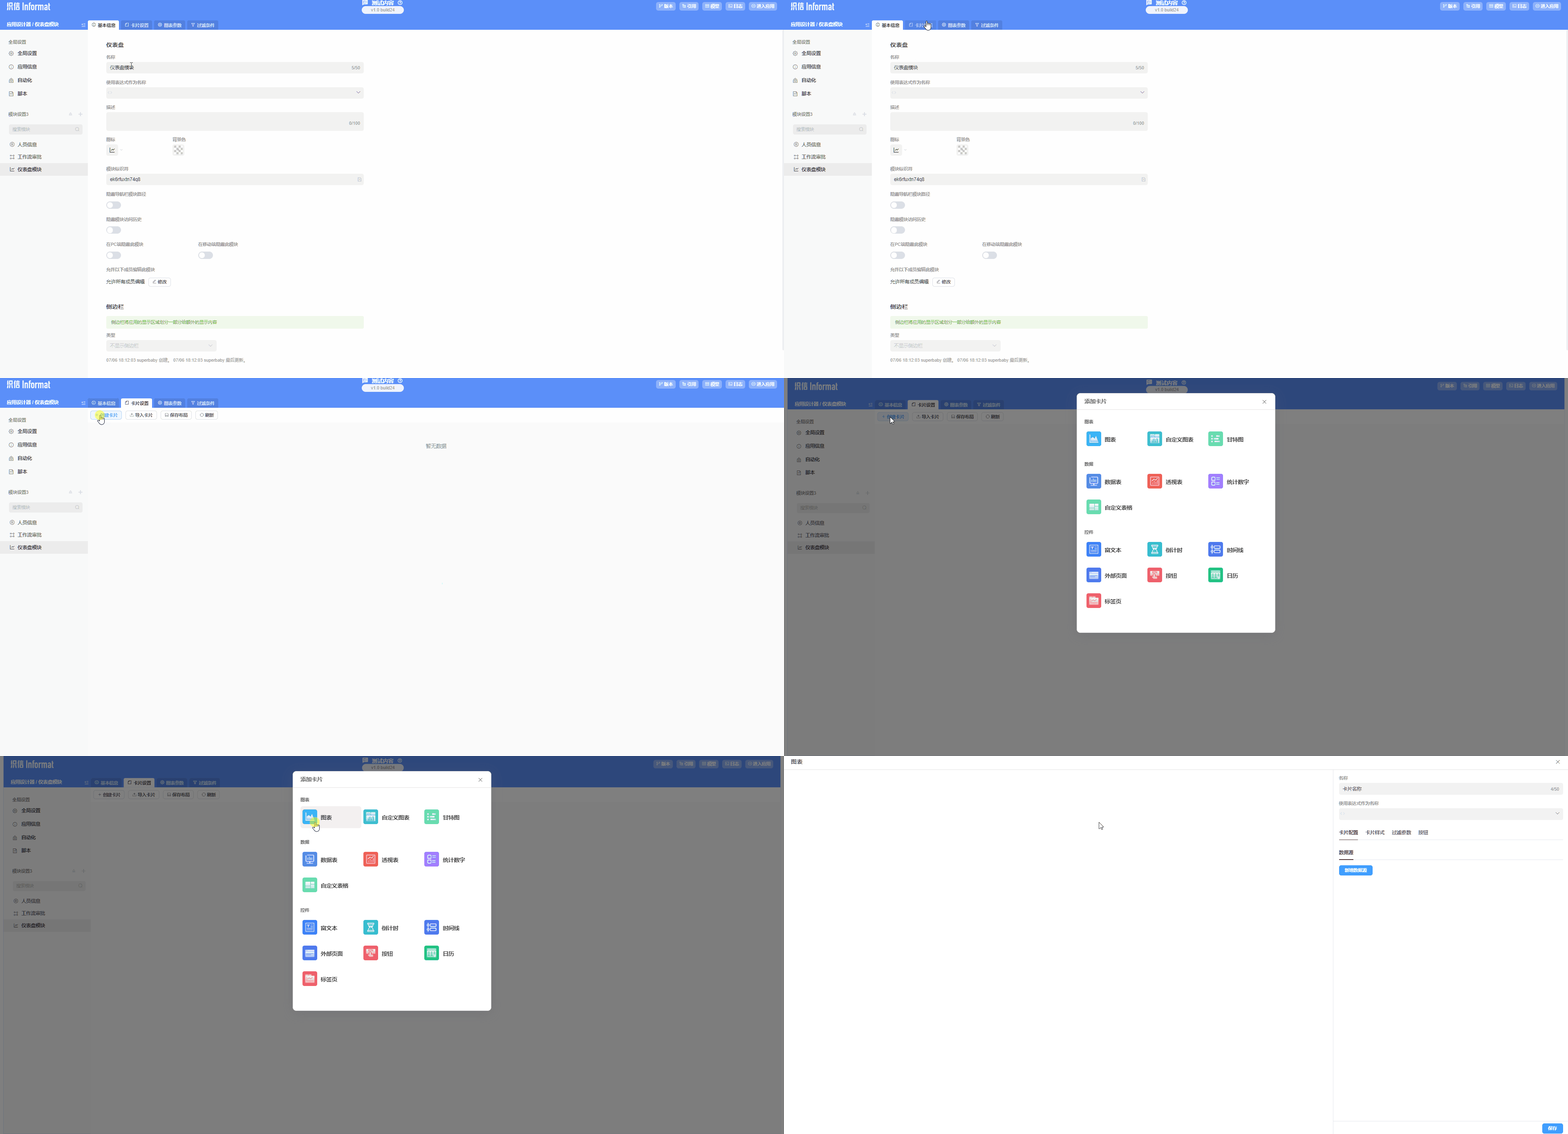
2.4 Set Data Source
In the created chart card, configure the data source information for the chart. 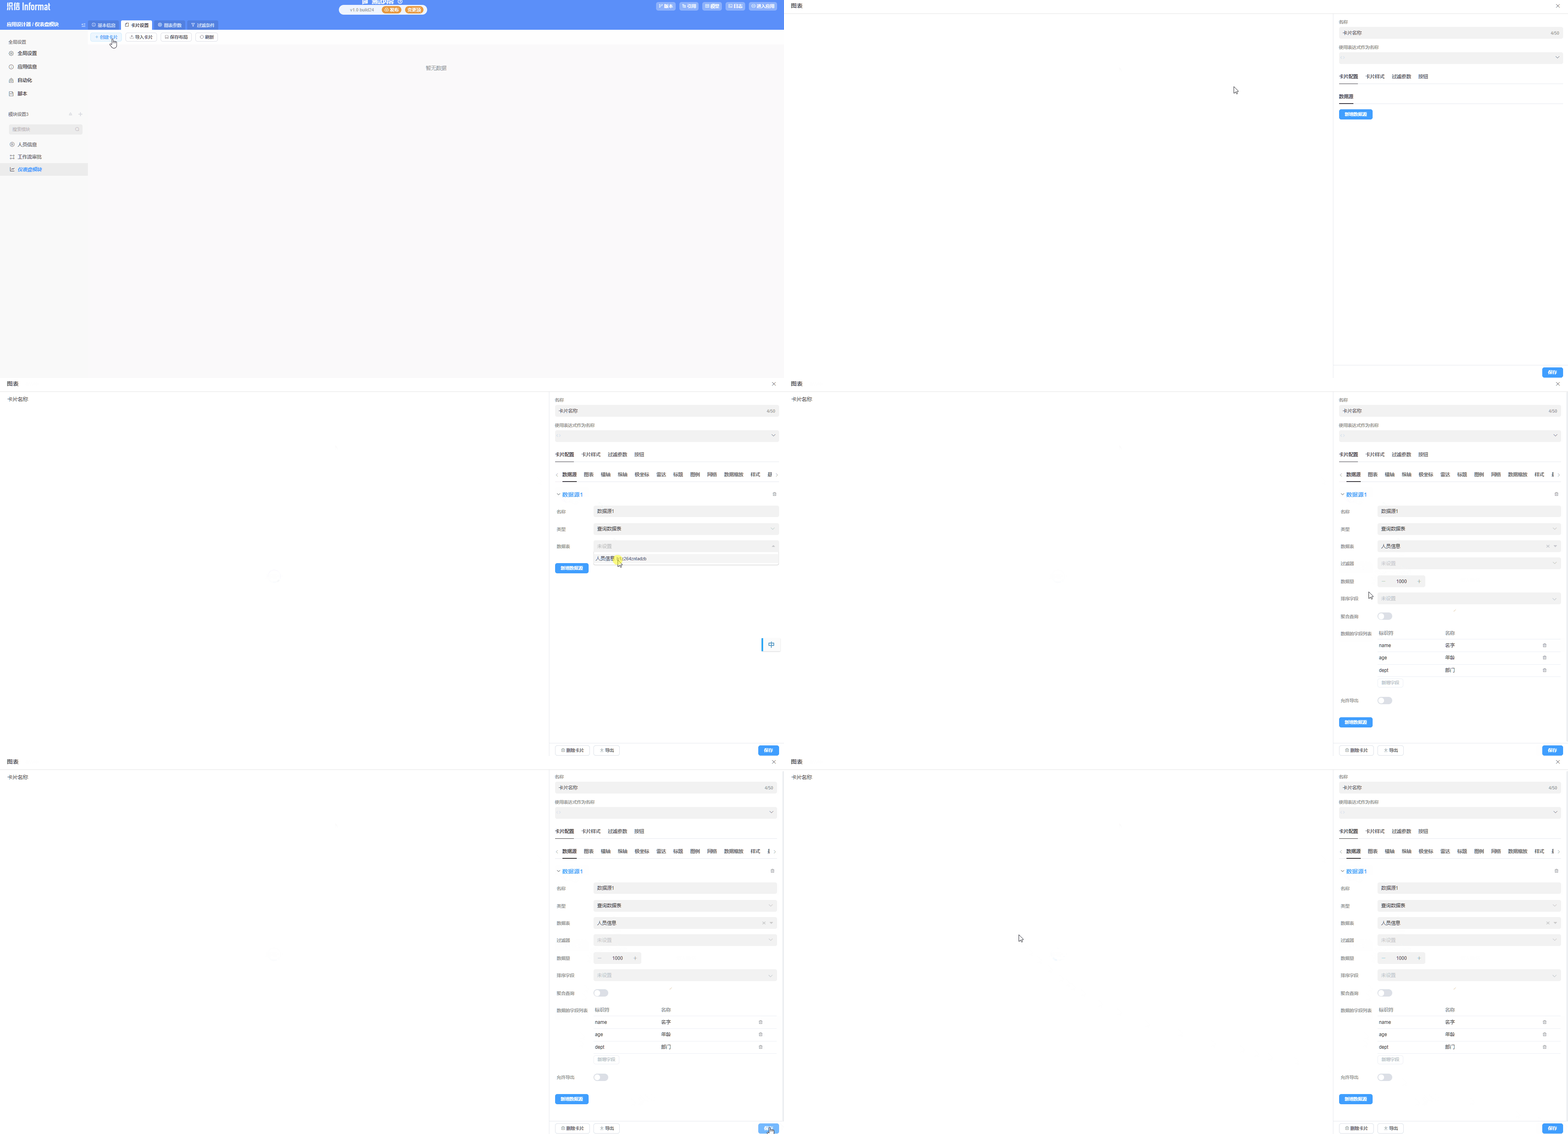
2.5 Configure Chart Information
In the created card, edit and configure the chart's dimensions, coordinates, and other information.